


2023 FF Newsletter Review

Greetings! This is not our usual newsletter (TLDR & conclusions at the end). With the conclusion of the 2023 fantasy football season, we wanted to review our first ever Draft Guide and share the results with our dedicated readers.
We’re going to delve into both the shortcomings and successes of our projections. If you have any feedback, we encourage you to share it in the Substack comments or reach out to us on Twitter at FFNewsletter. If you’re interested in keeping the conversation going, be sure to join us in the premium subscriber’s discord where we will also be sharing our rookie rankings, prospect analysis and off season dynasty reactions.
2023 Draft Guide
2023 PPG Results
Team Outlooks
All projections begin at the team level, so we based our projections on every team’s 2022 offenses Pass/Rush ratio and total offensive snaps. From there, we made some guesses at how changes in offensive philosophy might impact those numbers for 2023.

Of the 32 teams, we correctly guessed if there would be an increase or decrease in offensive snaps for 23 teams. Some were easy, like the Rams and Panthers, who were two of the worst offenses in 2022. Others, like the Colts, were very difficult to forecast. We were pretty close; on average we were within 59 snaps of each team’s total snap count through 18 weeks. This may sound like a lot, but on a per game basis we were only off by about 3 snaps per game.
The other projections we made on the Team Outlooks tab in the workbook linked above are each team's offensive Pass/Rush ratio. We correctly predicted an increase or decrease for 22 out of 32 teams on their pass/rush rate on offense from 2022 to 2023.

On average, we were within 3.5% of any given team's actual pass/rush rate; however, there were a few teams that really stood out as outliers. The Ravens and Bills rushed over 7% more than we projected, whereas the Commanders rushed 12% less than we expected. These were big misses and we hope to do better here as we refine our methodology in 2024.
Team Passing
Our team passing tab was handled differently than the rest of the draft guide. We used a variety of sports betting websites to determine the average total yards of passing offense a team was expected to have in 2023 by looking at the ‘over/under’ for their expected starting QB. From there, we used our projections for Team Pass Attempts to determine values such as: passing touchdowns and yards per attempt to calculate our projected passing yards for a team. While not every team’s starting Quarterback finished the year, we based our player receiving projections on these values and thus will be comparing our projections to these numbers anyways.
For evaluating our projections, we compared every team’s betting yards to their actual yards at the end of the season. From there, we determined whether each team would have hit their ‘over/under’ and then compared that result to what our recommended bet would have been, based on our projected yards.
Of the 25 teams that hit their over, we correctly guessed 19 of them. Of the seven teams that hit the under, we only predicted two of them correctly. Of the seven teams to hit their under that we missed on, four of them were due to their Quarterback sustaining a season ending injury: Jets (Aaron Rodgers), Bengals (Joe Burrow), Chargers (Justin Herbert), and Giants (Daniel Jones). That puts us at a total of 21 hits and 11 misses, or 21 hits and 7 misses if you ignore injury impacted results. On average, we were off by about 481 passing yards of offense or 48.1 receiving fantasy points.
2023 Rushing
Of all the projections and assumptions we made in our draft guide, this tab was undoubtedly the most subjective. We began by taking our projected number of rush attempts for each team and dividing them up across their three main running backs at the start of the year. For example:

This means that we projected Pacheco to carry 48% of the workload and the top three running backs to account for 89% of the team’s total rush attempts.
We were guessing here. How teams divide up their running back rooms can depend as much on pass blocking ability as it does rushing talent. Although that doesn’t mean we were just shooting in the dark either. Thanks to the unique focus of our newsletter, we are very in tune with teams’ roster decisions during the offseason. We correctly identified 22 teams’ leading rushers. Of our 10 misses, 5 of them were due to injuries, and we correctly identified the team’s primary backup in 8 of 10 injury-impacted cases. Our two complete misses were the Colts and Dolphins backfields. Mostert and Moss were both injured at the start of the year and we weren’t willing to give them significant rush shares when they were questionable for the season.
Unfortunately, this section was not all victories though. If we’re talking about failures, we might as well begin with the draft guide’s biggest miss. Christian McCaffrey was our RB2 and we only projected him to have 40% of the team’s rush share. Instead, CMC handled 54.5% of the 49ers rush attempts; Mason and Mitchell were barely even afterthoughts.

This section did have its fair share of victories too. We had the Lions backfield virtually perfect, and firmly believe it would have been 100% accurate if injuries did not occur.

Draft Guide users were also early buyers on Jaylen Warren’s breakout season, due to a projected 38% rush attempt share.

Overall, our most subjective section had its highs and lows, but we believe that these are exactly the kind of projections necessary to accurately predict teams’ futures.
Individual Teams
The main feature of the draft guide that you will not get in almost any other draft guide, is an exact breakdown of projections for every single team’s pass catchers and running backs.
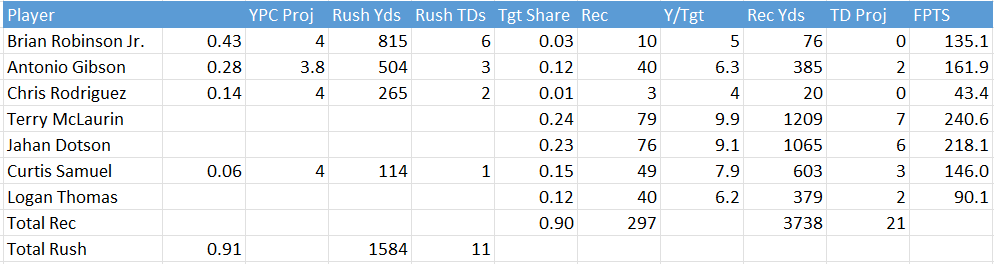
Using a combination of all of the aforementioned data tabs and the best analysis collected from our offseason newsletters, we built out a team projection page for every single team. At a minimum we projected three running backs, three wide receivers, and at least one tight end on every single team.
Before we get into the specifics, we should explain how we predicted touchdowns. We could have been subjective here too, but instead we chose to use the average rushing/receiving yards per touchdown numbers of 2022 and then estimated the number of touchdowns that a player would get. Example:

All of these estimations meant that some parts of the projections ended up better than others. For example, the Commanders threw the ball a lot, but just because they threw the ball a lot doesn’t mean they actually scored a lot of fantasy points. We projected Terry McLaurin to have a 24% target share and to have 9.9 yards per target (exactly how many yards per target he had in 2022).
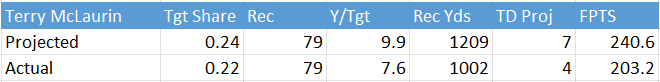
Unfortunately, McLaurin had Sam Howell as his quarterback. A gunslinger who was willing to go for the deep ball constantly no matter how bad of an idea it was. So McLaurin’s Y/Tgt fell to a career low and his yards per touchdown rate was the second worst he’s ever posted. While the target share and receptions were dead on, that only tells part of the story here.
Players to Highlight
Due to this style of ranking players, we ended up taking very firm stances for/against a few players and we wanted to highlight how that went for a few favorites. ADP courtesy of MyFantasyLeague.com.
Austin Ekeler - ADP: 4, Our Rank: 21. Ekeler was undoubtedly a disappointment for all of his owners this year; we highlighted him as a hard sell at his ADP and it paid off well.
Amari Cooper - ADP: 38, Our Rank: 25. Cooper was all but left for dead by many fantasy managers, and his ADP kept falling with each bad report about Deshaun Watson; we highlighted him as a major value which paid off well.
Najee Harris - ADP: 25, Our Rank: 58. Our draft guide was not kind to many middle round RBs such as Dameon Pierce, J.K. Dobbins, Dalvin Cook, and Miles Sanders, but it was harshest to Najee Harris. We did not see much improvement in store for the Steelers offense, so we predicted Harris would closely repeat his 2022 performance, and his PPG RB32 finish showed that we were correct.
Khalil Shakir - ADP: 227, Our Rank: 107. Shakir had the highest difference between his ADP and our rank. While Shakir wasn’t exceptional, his 113 PPR points were right where we had him projected.
Jamaal Williams - ADP: 98, Our Rank 180. Williams was a heartwarming story in 2022, but on a mediocre Saints offense we did not see the vision for a 2023 repeat. Williams was our draft guide’s number one most overrated player for 2023 and we were right on.
Overall
So how’d we do? (Reminder: We used only weeks 1-17 to determine PPG). If we graph out our projected points per game vs each player’s actual points per game, we get this graph for all 232 players we projected:
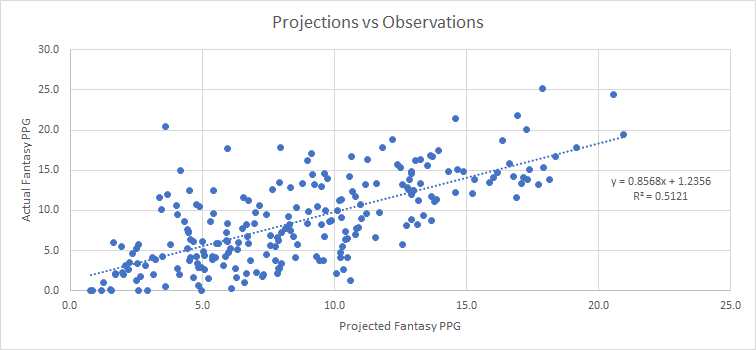
In simple terms, our best-fit line, represented by the equation y = 0.8586x + 1.2356, serves as an assessment of our fantasy football predictions. On average, players scored around 86% of the projected fantasy points, with an additional 1.24 points. The y-intercept of 1.24 points ensures the best fit for our model, but if we remove this constraint, the slope becomes 0.968, suggesting an approximate 3% overestimate on average. Although not perfect, as indicated by an R-squared value of 0.5121, which explains just over half of the variation in actual scores, our model demonstrates solid predictive power. Notably, it projected the exact points per game for Demarcus Robinson, Calvin Ridley, DeAndre Hopkins, and Scott Miller. In summary, we underestimated the NFL as a whole in 2023, but our overall accuracy speaks for itself.
With all that being said, determining how accurate we were is a tough task. So we went for a couple of different accuracy measures. The easiest would be to measure the difference between our projected points per game and our actual points per game.
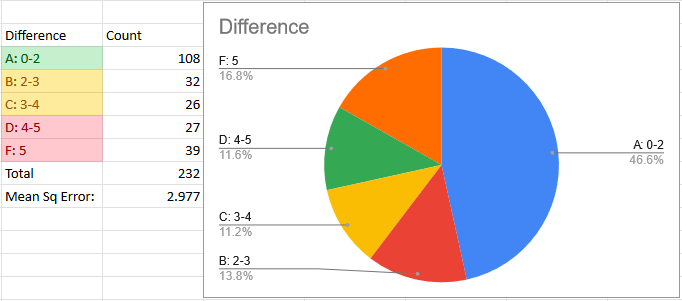
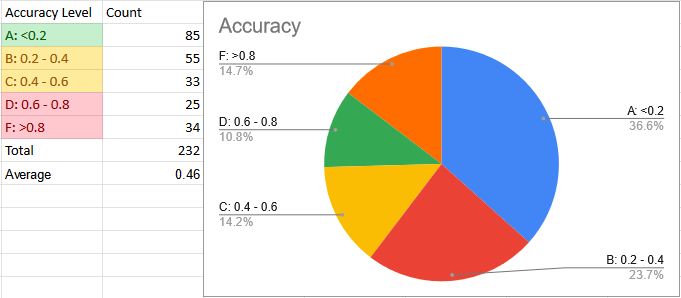
This is pretty subjective, but we determined that any player within 2 points per game would be considered an A, whereas any player that we were off by more than 5 points per game should be considered a failure. On average we were off by 2.977 PPG.
The problem with this accuracy method is that a player who we projected to get 3.9 points per game that actually got 0 would have the same score as a player who we projected to get 17.0 and got 14. So we added another accuracy measure, Relative Accuracy.
Relative Accuracy = 1 - |(Projected PPG - Actual PPG)/Projected PPG|
This created an accuracy value that would account for the level of the projected values. Player’s PPGs matter more at the higher end of scores. Here’s how those look on a graph:
While significant outliers such as Kyren Williams, Puca Nacua, and Tank Dell absolutely killed us, our draft guide showed that there was significant opportunity for someone on those offenses to step up. If had just added Van Jefferson’s points to Nacua’s he would have been an A level guess, but that’s not how the game works.
TLDR:
Our 2023 fantasy football Draft Guide showcased accuracy in predicting team-level metrics like offensive snaps and pass/rush ratios, but faced challenges with notable player outliers, especially in rushing projections. Despite some hits and misses on individual player stances, our overall performance indicated that our draft guide provided an obvious competitive advantage in 2023.
In our first year, we ventured into uncharted territory, and while there is room for enhancement, we are proud of the groundwork laid. Few analysts share their complete process at this level, and we intend to refine our methods for an even more effective draft guide in 2024. Reminder to please check out the Patreon Discord, and we will see you next season!
-Camaron Edgecomb, 2024